The Tests That Would Not Notice
Mike Crowe
This post was written with AI assistance (Claude) for structure and formatting. The data, the bugs, and the opinions are entirely my own.
Until I started building out an AI-driven SDLC this year, I had never run a mutation test. I’m not sure I could have told you what one was. I’ve been writing software for a long time, I’ve shipped plenty of code with a coverage badge on it, and I treated that badge as the answer to “is this tested?” It isn’t, and it took an agent pipeline to make me find out.
Here’s the thing: both projects in this post already had significant unit tests and good coverage. Neither one was a neglected codebase. Mutation testing and adversarial review still found a pile of problems in both, and that’s the point I care most about. When an AI writes most of your code, your tests are the only thing that proves it’s moving in the direction you intended. A suite that runs every line but wouldn’t notice a wrong one can’t do that job, so improving test quality has gone from a nice-to-have to the core of how I keep AI-written code honest.
I’ve written about where AI belongs in software delivery and about the PR that fooled me into adding adversarial review. Mutation testing came out of the same work. Once agents were writing most of the code, I needed checks that didn’t depend on me reading every line, and “the tests pass” turned out to be a much weaker statement than I’d assumed.
Mutation testing in two lines
A mutation tool makes a small change to your code (flip < to <=, delete an argument, swap a string), reruns your tests, and checks that some test fails. If no test fails, the mutant “survived”, which means your tests would not notice that change if a human or an agent made it for real.
That’s the whole idea. Coverage tells you a line ran. Mutation testing tells you whether anything would notice if that line were wrong.
The scenario
Here’s the scenario: a client app with a Python FastAPI backend and a TypeScript/SvelteKit frontend. It had a healthy test suite by the usual measures (about 80% statement coverage on the frontend) and nobody had any reason to think it was undertested. I added mutmut on the backend and StrykerJS on the frontend, then used the survivor lists to decide which tests to write.
The scope:
- Backend (mutmut 3.8): 32 Python files, about 2,200 non-blank lines of production code, 1,766 mutants.
- Frontend (StrykerJS 10): 16 TypeScript files, about 1,180 non-blank lines, about 1,070 mutants.
- Total: about 3,400 lines in 48 files, roughly 2,800 mutants.
Stryker only mutated .ts files. The .svelte components were out, for reasons I’ll get to in the gotchas.
The numbers
| Measure | Before | After |
|---|---|---|
| Backend mutants detected (killed or timed out) | 65% (1,139 of 1,757) | 82% (1,447 of 1,766) |
| Backend survivors | 613 | 319 |
| Frontend mutants killed | 257 | 723 |
| Frontend survivors | 464 | 141 |
| Frontend mutants with no covering test | 345 | 202 |
| Backend tests | 294 | 399 |
| Frontend unit tests | 501 | 695 |
Some per-file moves on the frontend: a schema validator went from 10% to 77%, an auth module from 34% to 89%, a types module from 15% to 97%. On the backend, the LLM client dropped from 131 survivors to 43 and the index loader from 101 to 42.
Both “before” columns were taken after I fixed two tool problems, so they aren’t a raw first run. A raw first run would have looked much worse, and most of that would have been environment noise.
What it actually found
None of this was known before I started. Where a survivor led straight to the bug I’ll say so, and where it only pointed me at the right module I’ll say that instead.
Three real application bugs
The streaming client missed the standard end-of-stream signal. It read finish_reason only from the delta object, but OpenAI-compatible streams put it on the choice. A quick probe showed tokens after the stop signal still came through:
# before the fix
['Hello', 'AFTER-STOP']
# after the fix
['Hello']
The impact is bounded because a [DONE] marker normally follows, but a proxy that omits it would leak trailing content or never stop. The existing test passed because it used a non-standard stream shape. A surviving mutant in the stream parser led directly to this one.
Two of the three chunking strategies silently dropped any text before the first heading. The baseline strategy kept it; heading-aware and hybrid didn’t. So switching strategies would quietly lose content. It’s latent (no current page has text above its first heading, and production uses the baseline), but it was sitting there waiting. A surviving mutant in the section splitter led to it, and the new tests fail on the old code and pass on the fix.
A greedy frontmatter regex made a full index rebuild impossible for a third of the content. Any page body with a markdown horizontal rule (---) got swallowed into the YAML block and crashed the parser. That hit 123 of 354 source pages. Production kept working only because the committed index predated those pages; a rebuild would have failed. The fix was one character, * to *?. The survivor list sent me into that module, but I found the bug by probing real data while sizing the chunking problem. The tool narrowed where to look and I made the find.
The test suite had bugs too
- A fixture removed a shared auth override, so component auth tests returned 401 depending on test order. The default order hid it, and nine tests failed under a different order. mutmut runs the suite in its own order as a “clean run” check, which is how this surfaced.
- A depth-filter test could not fail. Its fixture page was small enough to be filtered out as a stub anyway, so the test passed with the depth filter deleted entirely.
The surprise: a slow tool forced me to look at a slow suite
Mutation testing reruns your tests for every mutant. A suite that takes 48 seconds is a minor annoyance when you run it once, and a real problem when the tool runs it against hundreds of mutants. So before I could get useful sweeps, I had to find out why the tests were slow.
The first answer was embarrassing. Two retry tests slept for real, 7 seconds each, because nobody had mocked sleep() in the exponential backoff. The tests were sitting through the actual retry delays. Patching the sleep took those seconds out, and it also let me assert the backoff schedule, which nothing had checked before.
The second answer was worse. Every test-client startup posted spans and events to a real collector and an Application Insights endpoint, about a second of network time per test. Our unit tests were sending telemetry to production monitoring and nobody knew. A single environment variable (dummy mode in the monitoring library) stopped it.
Between the two fixes, the backend suite dropped from 48.6 seconds to about 27. Neither came from a surviving mutant. They came from the cost of running mutation testing at all, which made a slow suite too expensive to ignore. Some of the value came from the tool, and some came from the work the tool forced me to do around it.
Gaps with no bug, but nothing guarding them
- The retrieval core (cosine-similarity search) had no tests at all, zero-vector and ordering behavior included.
- The LLM client’s request URL, headers, payload keys, and defaults were untested.
- The embeddings client’s batching and order preservation were untested.
- JWT validation had holes around required claims, exact issuer matching, identity-claim fallbacks, and key-rotation refresh.
- The chat markdown renderer, which sanitizes untrusted model output, had no tests.
That last one should make anyone nervous. It’s the code standing between an LLM’s output and your users’ browsers, and the coverage report gave no hint it was bare.
How I added it
- Install with the project’s existing package managers: mutmut as a Python dev dependency, Stryker and its Vitest runner as npm dev dependencies. Commit the lockfiles.
- Scope it to production code only. Exclude tests, generated output, and vendored code.
- Smoke-test one backend module and one frontend file first.
- Fix environment problems until a clean run works.
- Run the full sweep and read the results as a ranked list of “tests that would not notice.”
- Triage. Separate log-message and string-literal survivors from logic survivors, because their value is wildly different.
- Write tests for the logic survivors and run each against the unmodified code. A new test that fails there has found a bug.
- Re-run the affected modules and compare.
Here are some of the things that drove me crazy
- The tools copy your tree. mutmut runs tests in a copy of the repo, so every file the app reads at import time or in tests (config, content, data) has to be listed to get copied.
- A dangling symlink crashed the copy. Listing source directories one at a time worked around it.
- A macOS-only crash looked like a real result. Proxy auto-detection crashed forked workers that built an HTTP client, and mutmut reported 383 mutants as “segfault.” Setting the no-proxy variable fixed it. Without that, the LLM and embeddings modules would have looked untestable.
- Timeouts count as detected. A mutant that breaks a loop makes a test hang until the time limit, and the tool scores that as a kill. About 170 mutants ended that way, and they dominate the runtime.
- Stryker can’t score Vitest Browser Mode tests. All the component tests here use it, so five files sit at 0% even though they have tests. That’s also why I didn’t mutate the Svelte components: every mutant would have shown “no coverage.”
import.meta.globbreaks instrumentation. Stryker rewrites its string argument, so four files that use it are excluded.- No type-checker plugin, so some frontend survivors are mutants that wouldn’t even compile.
- Run time isn’t constant. The backend sweep took about 6 minutes alone and about 35 minutes once when other jobs overlapped. I never pinned down why.
What it cost
Raw wall clock was about 19 hours, but most of that was an overnight gap and a few stretches where I walked away. Capping idle gaps at 20 minutes puts active time at about 4 hours. I sent 12 prompts total. The machine time is small (about 6 minutes for the backend sweep, 2 for the frontend), so nearly all the elapsed time went into writing the tests the survivors pointed at.
The output was about 300 new tests, roughly 2,300 lines of test code, 230 lines of tooling and CI config, and 5 lines of application fixes. Five lines. That ratio tells you where the work is.
On tokens: about 190,000 output tokens and 57 million cache-read tokens across 286 turns, and that’s a lower bound because the transcripts miss part of the session. The cache-read number looks scary but it’s the conversation being re-read each turn, billed far below fresh input. What kept it from ballooning was redirecting every command’s output to a file and reading only summaries. Unfiltered mutation output will eat a context window alive.
Why this changed how I think about review
This is where the client work connects to my own projects. In harnessed, I went back through 42 PRs over six weeks and tallied every finding by whatever layer caught it, counting only what the PR body names explicitly:
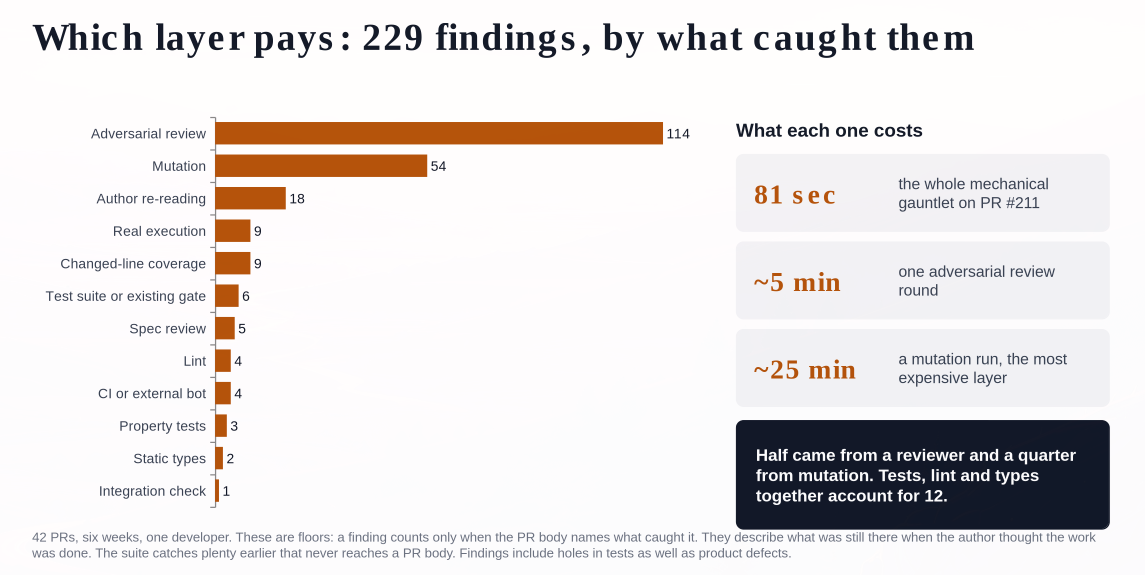
Look at the third bar. “Author re-reading” is me reading the PR, which is the traditional human code review I’ve done my whole career. It caught 18 findings. Adversarial review caught 114 and mutation testing caught 54. Together those two layers found more than nine times what my own careful reading did.
I’m not throwing out human review. I still read every PR, and I still approve every merge, because people approve and agents check. But for most of my career, reading the diff was the quality process, with tests, lint, and types as a safety net underneath. This chart says the safety net and my reading together account for a sliver. Tests, lint, and types combined found 12.
The cost side matters too. The whole mechanical gauntlet on one PR ran in 81 seconds. An adversarial review round is about 5 minutes. A mutation run is the expensive layer at about 25 minutes. A quarter of my findings for 25 minutes of machine time is a trade I’ll take every time.
What this doesn’t prove
- I’m not claiming a code review could never find the client-app bugs. But my team cross-reviewed that code, and we missed every one of them. As we accelerate with more AI-generated code, that kind of miss is only going to get more common.
- About half the 319 remaining backend survivors look like log-message or string changes, but that’s an unverified heuristic.
- I counted the ~170 timeouts (141 in the chat router alone) as detected and didn’t investigate them.
- I wrote the CI workflow and helper commands but haven’t run them end to end yet. I ran the tools directly.
- I deliberately set no score threshold. There’s no baseline to justify one, and the timeouts and browser-only code need a decision first.
- The harnessed numbers are floors. A finding counts only if the PR body names what caught it, so anything the suite caught earlier never shows up.
Run it as an audit, not a gate
If you take one thing from this: point a mutation tool at a codebase you think is well tested and read the survivor list. Don’t make it a CI gate on day one, because the first runs mostly measure your environment problems. Treat the output as a ranked list of places your tests wouldn’t notice a change, and go write the tests it asks for.
I spent years trusting a green coverage report. Four hours with mutmut and Stryker found three bugs, a test that couldn’t fail, and my unit tests chatting with production telemetry. That was a well-tested codebase. If the AI is going to write the code, the tests are how I steer it, and I want tests that would actually notice when it drifts.
Have your own mutation testing stories, or a survivor that turned into a real bug? Hit me up on GitHub or wherever you found this post.